*The information below comes from the MPC (Mortgage Professionals Canada) Market Review for August 2023
Economists were expecting an uptick to 3% annually from June’s reading of 2.8%, but the actual number came in at 3.3%, including a 0.6% monthly increase in July alone.
That surprise was enough to send bond yields spiking higher, with the bellwether 5-year yield jumping to fresh 16-year highs of 4.15%.

We can expect more inflation volatility to come. Base effects from low monthly CPI increases in August and September 2022 will drop out of the annual data set over the next two months, and that means we’ll likely see the reported annual inflation rate rise. In fact, if the CPI rises even a small percentage of 0.2% each month for the remainder of the year, we’ll finish out 2023 with an inflation rate over 4%. And if the CPI averages a 0.3% monthly gain (in line with the average over the past six months), we’ll end up with an inflation rate pushing 5%.

Mortgage professionals should brace for more unpleasant rate changes. They should also inform clients and prospects that part of the acceleration in CPI is a function of base effects that will wane with time and the Bank of Canada has already baked this into their inflation projections.
Mortgage Market Update
Deep-discounted mortgage rates remain at 15-year highs for both 5-year fixed and variable terms. High rates and challenging affordability continue to weigh on demand. Originations remain roughly 40% below peak but did stabilize in June where they were effectively unchanged from year-ago levels. There’s been a notable skew towards 3- and 4-year fixed rate products in recent month, with that bucket now accounting for over half of all new originations.
With rising mortgage rates, the monthly payment needed to buy into the market today has risen by roughly 15%, or $400, since March.


Taking Steam Out of the Housing Market
Not surprisingly, we’re seeing sales come under pressure, which were down 0.7% month-over-month in July. But that headline figure hides some important geographical differences: Ontario and B.C. saw sales fall 5.5% and 2.6%, respectively, while more affordable Alberta saw sales jump 4%.
New listings jumped 5.6% month-over-month, which helped push the sales-to-new listings ratio, a simple measure of supply and demand, down to 59% from 63% previously.
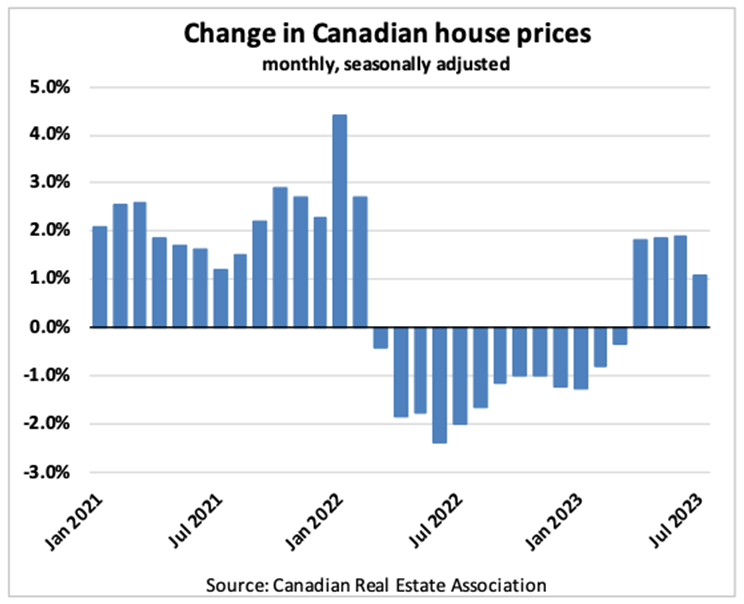
Prices rose 1.1% month-over-month nationally, a notable deceleration from the 2% monthly gains we’ve seen over the past three months.

House prices nationally remain almost 12% below peak levels, but with notable regional variations:
National: -11.5%
Calgary: At Peak!
Greater Vancouver: -4.1%
Montreal: -5.4%
Winnipeg: -5.9%
Halifax: -6.2%
Edmonton: -7.6%
Ottawa: -10.3%
Greater Toronto: -12.8%
Hamilton: -17.9%
Kitchener: -19.3%
London: -21.3%

